Gamma flows
Where dealer gamma sits, where it flips, and what that does to price.
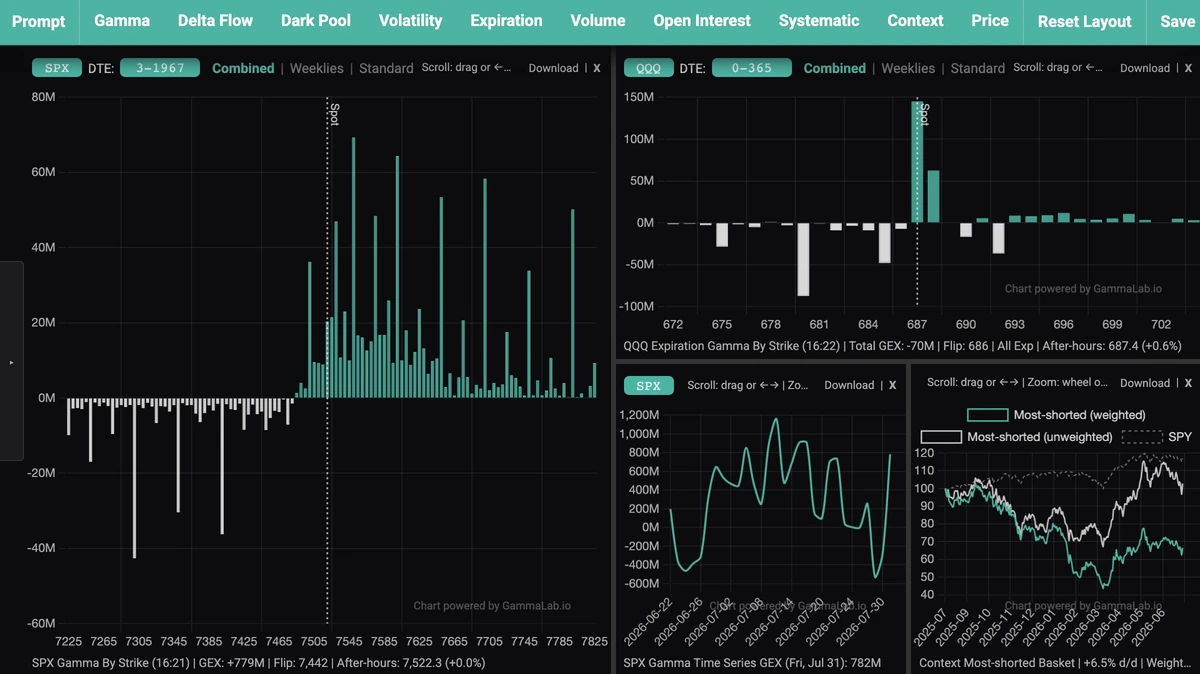
Gamma exposure decides how hard market makers have to hedge as price moves. It is the single best predictor of whether a market grinds in a range or accelerates, and it is mechanical: dealers hedge because their books require it, not because they have a view.
What dealer gamma exposure (GEX) actually tells you
Every option a dealer holds carries gamma: the rate at which its delta changes as the underlying moves. Aggregate that across the whole open interest and you get the market's net dealer gamma exposure: how much hedging flow a one-point move will force, and in which direction.
When dealers are long gamma, they hedge by selling into strength and buying into weakness. That flow is stabilising: volatility gets damped, ranges hold, and pullbacks find bids that have nothing to do with sentiment.
When dealers are short gamma, the same mechanic runs in reverse. They must buy as price rises and sell as it falls, chasing the move in both directions. Ordinary selloffs turn disorderly, and liquidity thins out at exactly the moment you need it.
The level where the aggregate flips between the two is the gamma flip level, and it is one of the most-watched lines on an index chart for good reason: the character of the tape genuinely changes as price crosses it.
What you get in GammaLab
- GEX by strike: the full gamma profile across the strike ladder, so you can see where the walls are rather than reading a single headline number.
- Gamma by expiration: how much of that exposure rolls off this Friday, and how much is genuinely long-dated. Two identical GEX totals mean different things if one is 0DTE and the other is a quarterly.
- Spot vs gamma: the flip level plotted against where price actually is, updated through the session.
- Prior-session overlay: today's profile against yesterday's, which is how you spot positioning changing rather than just reading a snapshot.
- DTE filters: isolate 0DTE, the front week, or strip the short end out entirely.
- Broad coverage: SPX plus a large, growing list of single stocks and ETFs, all built from the full option chain rather than a sampled subset.
Where the data comes from
GammaLab collects the whole option chain on its own schedule and rebuilds the gamma surface repeatedly through the trading day. Open interest is the real, full chain figure: nothing is estimated up from a sample. The charts refresh on their own while you have them open.
You can see a free, once-a-day version of the index reading on our public SPX gamma exposure page. The live, multi-ticker, intraday version is in the app.
How traders use it
Gamma flows are context, not a signal. A short-gamma tape says size down and expect follow-through; a long-gamma tape says fade the extremes and expect the range to hold. Large strikes with concentrated gamma act as magnets into expiry. And when the flip level sits just below spot, you know precisely which level turns a quiet session into a fast one.